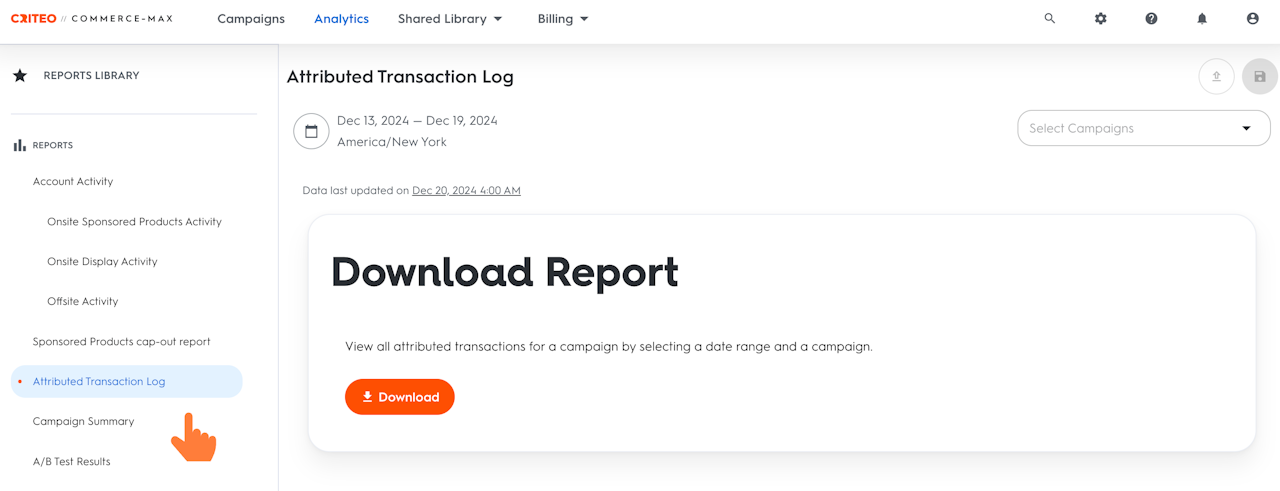

Attributed Transaction Log
The Attributed Transaction Log report offers a comprehensive dataset that provides valuable insights into the products purchased and attributed to your ads. By analyzing this data, you can gain a deeper understanding of how your ads influence customer behavior and the path to purchase.
Report Overview
The Attributed Transaction Log Report tracks the entire customer journey, from the time a customer clicks on your ad to the moment they make a purchase. It provides detailed data on the products that were advertised and the products that were ultimately purchased, allowing you to compare these elements for further insights.
Key Features
Compare Ad Display Time vs. Purchase Time: The report allows you to analyze the time when your ad was displayed versus the time when the purchase occurred. This helps you understand the impact of your ads on the purchase decision, including any time lag between ad interaction and the transaction.
Compare Advertised Product vs. Purchased Product: You can also compare the product that was advertised in your ad with the actual product that was purchased. This helps you measure the effectiveness of your product targeting and promotional strategies.
Breakdown by Campaign: The report can be broken down by one or more campaigns, providing insights into each campaign’s contribution to attributed transactions. This allows you to see the specific impact of each campaign on customer purchases.
Complete Customer Journey: This report provides an end-to-end view of the customer journey, showing the entire sequence of events from when a customer clicked on the ad to when they made a purchase. You’ll see all the data points in between, helping you understand the factors that influence conversions.
Other key features include attribution information for:
Keyword Used in the Purchase: Identify the specific keyword that led to the purchase, allowing you to optimize your keyword strategy and improve targeting.
Page Type Where the Purchase Occurred: See which type of page (e.g., search results, category page, product detail page) resulted in the purchase, helping you refine your strategy for high-conversion page types.
Sales Channel: Track whether the sale was recorded online or offline, giving you a fuller picture of how your ads influence both digital and in-store purchases.
Number of Units Sold: View how many units were purchased in each order, helping you assess the volume of sales driven by your campaigns.
Engagement Type (Impression or Click): Determine whether the purchase was influenced by an impression or click, based on your campaign’s attribution settings, to understand how each form of engagement contributes to conversions.
Sales Revenue: Monitor the total revenue generated from each order, enabling you to evaluate the return on investment (ROI) and financial impact of your campaigns.
How to Use the Report?
The Attributed Transaction Log Report is ideal for advertisers looking to:
Track the effectiveness of ads in driving conversions
Analyze customer behavior and decision-making processes
Compare how different campaigns or ads perform in terms of driving actual purchases
Identify potential areas for optimization in ad targeting, creative, and product promotion
By understanding the entire customer journey, you can refine your strategies to increase ad effectiveness, improve targeting, and ultimately boost sales.
